Active projects and challenges as of 19.11.2024 09:24.
Hide full text Print CSV Data Package
ClimateSciGraph
allows browsing of temperature data from nbcn stations, currently from switzerland only
The ClimateSciGraph app enables visualization of daily climate data (pressure, precipitation, radiation, temperature and humidity) from MeteoSwiss in tables and graphs. Data can be aggregated by various temporal intervals, ranging from daily to decadal. Additionally, the app incorporates the MannKenall statistical test to detect and analyze climate trends.
Die App ClimateSciGraph ermöglicht die Visualisierung der täglichen Klimadaten (Luftdruck, Niederschlag, Strahlung, Temperatur und Feuchte) von MeteoSchweiz in tabellarischer und grafischer Form. Die Daten können auf verschiedenen Zeitskalen von täglich bis dekadisch aggregiert werden. Zusätzlich beinhaltet die App den statistischen Test nach MannKenall, um Klimatrends zu erkennen und zu analysieren.
L'application ClimateSciGraph permet de visualiser les données climatiques quotidiennes (pression, précipitations, rayonnement, température et humidité) de MétéoSuisse sous forme de tableaux et de graphiques. Les données peuvent être agrégées selon différents intervalles temporels, allant de la journée à la décennie. En outre, l'application intègre le test statistique de MannKenall pour détecter et analyser les tendances climatiques.

Data
Fundberichte
Freiburger archäologische Fundberichte - Chroniques archéologiques du canton de Fribourg
Die kartenzentrierte Webapplikation ermöglicht den Zugriff auf die vom Amt für Archäologie des Kantons Freiburg (AAFR) veröffentlichten archäologischen Fundberichte mit ihrer geographischen Verortung. Neben den gängigen GIS-Werkzeugen bietet die Anwendung eine ausgefeilte Such-/ und Filterfunktion die es erlaubt, die Berichte nach Jahr des Fundes, Ort, Epoche oder Fundstellenkategorie zu filtern. Die Fundberichte können im PDF-Format eingesehen werden.
L'application cartographique en ligne permet d'accéder aux chroniques archéologiques publiées par le Service archéologique du canton de Fribourg (SAEF) et de les localiser géographiquement. Outre les outils GIS usuels, l'application offre une fonction de recherche et de filtrage sophistiquée qui permet de filtrer les vestiges mis au jour par année, localité, époque ou nature du site archéologique. Les chroniques archéologiques peuvent être consultées au format PDF.
The web map application provides access to the archaeological find reports published by the Office of Archaeology of the Canton of Fribourg (AAFR) with their geographical location. In addition to the usual GIS tools, the application offers a sophisticated search and filter function that allows the reports to be filtered by year of discovery, location, epoch or site category. The find reports can be viewed in PDF format.
Data
https://opendata.swiss/de/dataset/chroniques-archeologiques-fribourgeoises
Ladestationen
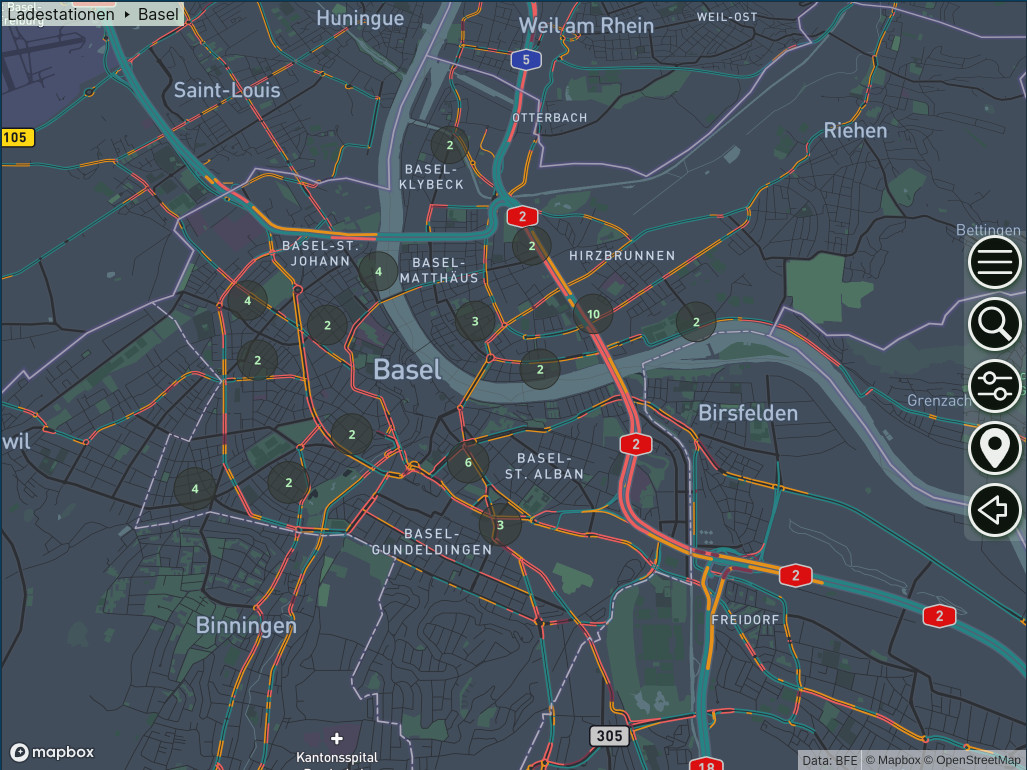
Interaktive Karte mit Ladestationen für Elektrofahrzeuge
Interaktive Karte mit Ladestationen für Elektrofahrzeuge in der Schweiz und Umgebung. Im Vordergrund steht die Benutzerfreundlichkeit, insbesondere für Personen, die unterwegs sind.
Carte interactive des stations de recharge pour véhicules électriques en Suisse et dans les environs. Une attention particulière a été portée à la facilité d'utilisation, notamment pour les personnes en déplacement.
Interactive map with charging stations for electric vehicles in Switzerland and the surrounding area. The focus is on user-friendliness, especially for people on the move.
Data
https://opendata.swiss/de/dataset/ladestationen-fuer-elektroautos
National Council elections
Nationalratswahlen 2023: Kandidat:in Suche
The website is used to search for candidates who have stood for the 2023 National Council elections in Switzerland. Users can search for a specific candidate using their first name or surname as well as carry out more detailed searches based on various criteria such as canton, list and place of residence. This app was created because the developer wanted to find out how many votes a candidate had received. So far, she has not found an easy way to do this.
Die Webseite dient zur Suche von Kandidat:innen, die für die Nationalratswahlen 2023 in der Schweiz kandidiert haben. Nutzer:innen können sowohl gezielt nach einem Kandidaten mithilfe seines Vor- oder Nachnamens suchen als auch detailliertere Suchen basierend auf verschiedenen Kriterien wie Kanton, Liste und Wohnort durchführen. Diese App entstand, weil die Entwicklerin herausfinden wollte, wie viele Stimmen ein Kandidat erhalten hat. Bisher hat sie keine einfache Möglichkeit dafür gefunden.
Le site web sert à la recherche de candidats qui se sont présentés aux élections du Conseil national 2023 en Suisse. Les utilisateurs peuvent rechercher un candidat de manière ciblée à l'aide de son prénom ou de son nom, mais aussi effectuer des recherches plus détaillées sur la base de différents critères tels que le canton, la liste et le lieu de résidence. Cette application a été créée parce que la développeuse voulait savoir combien de voix un candidat avait obtenu. Jusqu'à présent, elle n'avait pas trouvé de moyen simple de le faire.

Data
NRW23 Candidate Search App

Table of Contents
Introduction
This repository contains a Flask application designed for users to search for candidates who participated in the 2023 Nationalrat elections (Switzerland). It primarily showcases detailed information about a candidate, emphasizing the number of votes they received.
Repository Structure
NRW23/
│
├── files/
│   └── NRW2023-kandidierende.zip  # Data containing candidate information
│
├── static/
│   ├── JS/
│   │   └── script.js             # JavaScript file for interactive features
│   │
│   └── styles.css                # CSS file for the web application styling
│
├── templates/
│   ├── detail.html               # Detail page template for a specific candidate
│   ├── index.html                # Main page template for search feature
│   ├── privacy-policy.html       # Privacy policy template
│   └── results.html              # Results page displaying candidates
│
├── .gitignore                    # Patterns of files/directories to ignore in git
│
├── app.py                        # Main Flask app script
│
├── LICENSE                       # License file
│
├── main_routes.py                # Routes for the Flask app
│
├── README.md                     # README documentation
│
├── requirements.txt              # List of required Python packages for the app
│
└── utils.py                      # Utility functions for the app
Getting Started
Local Deployment
Clone the Repository
bash
git clone https://github.com/devobern/NRW23/tree/main
Navigate to Directory
bash
cd NRW23
Create & Activate Virtual Environment
Ensure you havepython3andvirtualenvinstalled.bash virtualenv env source env/bin/activateInstall Dependencies
bash
pip install -r requirements.txt
Run the App
bash
python run.py
Access Locally
The application will be accessible at http://127.0.0.1:5000/.Note: Due to the Content Security Policy (CSP), the app cannot be run locally without dev certificates. To address this, you can use mkcert to generate your own certificate. For a guide on how to use mkcert, please refer to this tutorial.
Online Access
Access the hosted application here.
Disclaimer
This application is an ongoing project and serves as a bit of a playground for me. It was developed with the primary motivation to provide a simple platform to view the votes received by individual candidates. There might be occasional issues or aspects that need refinement. Feedback and suggestions are always welcome.
License
This project is licensed under the MIT License - see the LICENSE file for details.
Dataset Information
The data used in this repository is sourced from the Bundesamt für Statistik BFS and relates to the Nationalratswahlen 2023.
- Dataset Name: NR - Kandidierende
- Publication Date: 8. August 2023
- Format: JSON
- Access URL: Link to Dataset
License for Dataset
The dataset is available under the "Freie Nutzung. Quellenangabe ist Pflicht" terms. Users can use this dataset for both non-commercial and commercial purposes, but proper attribution is required.
Attribution:
Autor:in: Bundesamt für Statistik BFS
Titel: NR - Kandidierende
Link zum Datensatz
Contact
For inquiries or suggestions, please reach out via email.
Parl Debate Scanner
Der ParlDebateScanner ist ein privates Projekt, mit welchem die Wortprotokolle der Debatten im Schweizer Parlament semantisch und sprachunabhängig durchsucht werden können. Die im Tool gezeigten Daten basieren auf der Open Data API der Parlamentsdienste.
Le ParlDebateScanner est un projet privé qui permet d'effectuer des recherches sémantiques indépendemment de la langue dans les procès-verbaux des débats du Parlement suisse. Les données affichées dans l'outil sont basées sur l'API Open Data des Services du Parlement.
The ParlDebateScanner is a private project that allows semantic and language-independent searching of verbatim transcripts of debates in the Swiss Parliament. The data displayed in the tool is based on the Open Data API of the Parliamentary Services.

Data
https://opendata.swiss/de/dataset/webservices-httpws-old-parlament-ch
SchweizMobil
Die Schweiz und das Fürstentum Liechtenstein auf den schönsten Wegen erleben, unkompliziert und umweltfreundlich.Das ist SchweizMobil.
Découvrir la Suisse et la Principauté du Liechtenstein sur les plus beaux chemins, en toute simplicité et dans le respect de l’environnement.SuisseMobile, c’est ça.
Scoprire la Svizzera e il Principato del Liechtenstein in modo semplice e rispettoso dell'ambiente lungo i percorsi più belli.Questa è SvizzeraMobile.

Data
https://opendata.swiss/de/dataset/langsamverkehr-wanderland-schweiz
https://opendata.swiss/de/dataset/langsamverkehr-veloland-schweiz
https://opendata.swiss/de/dataset/langsamverkehr-skatingland-schweiz
Smart Urban Heatmap Bern
API Dokumentation zu smart-urban-heat-map.ch
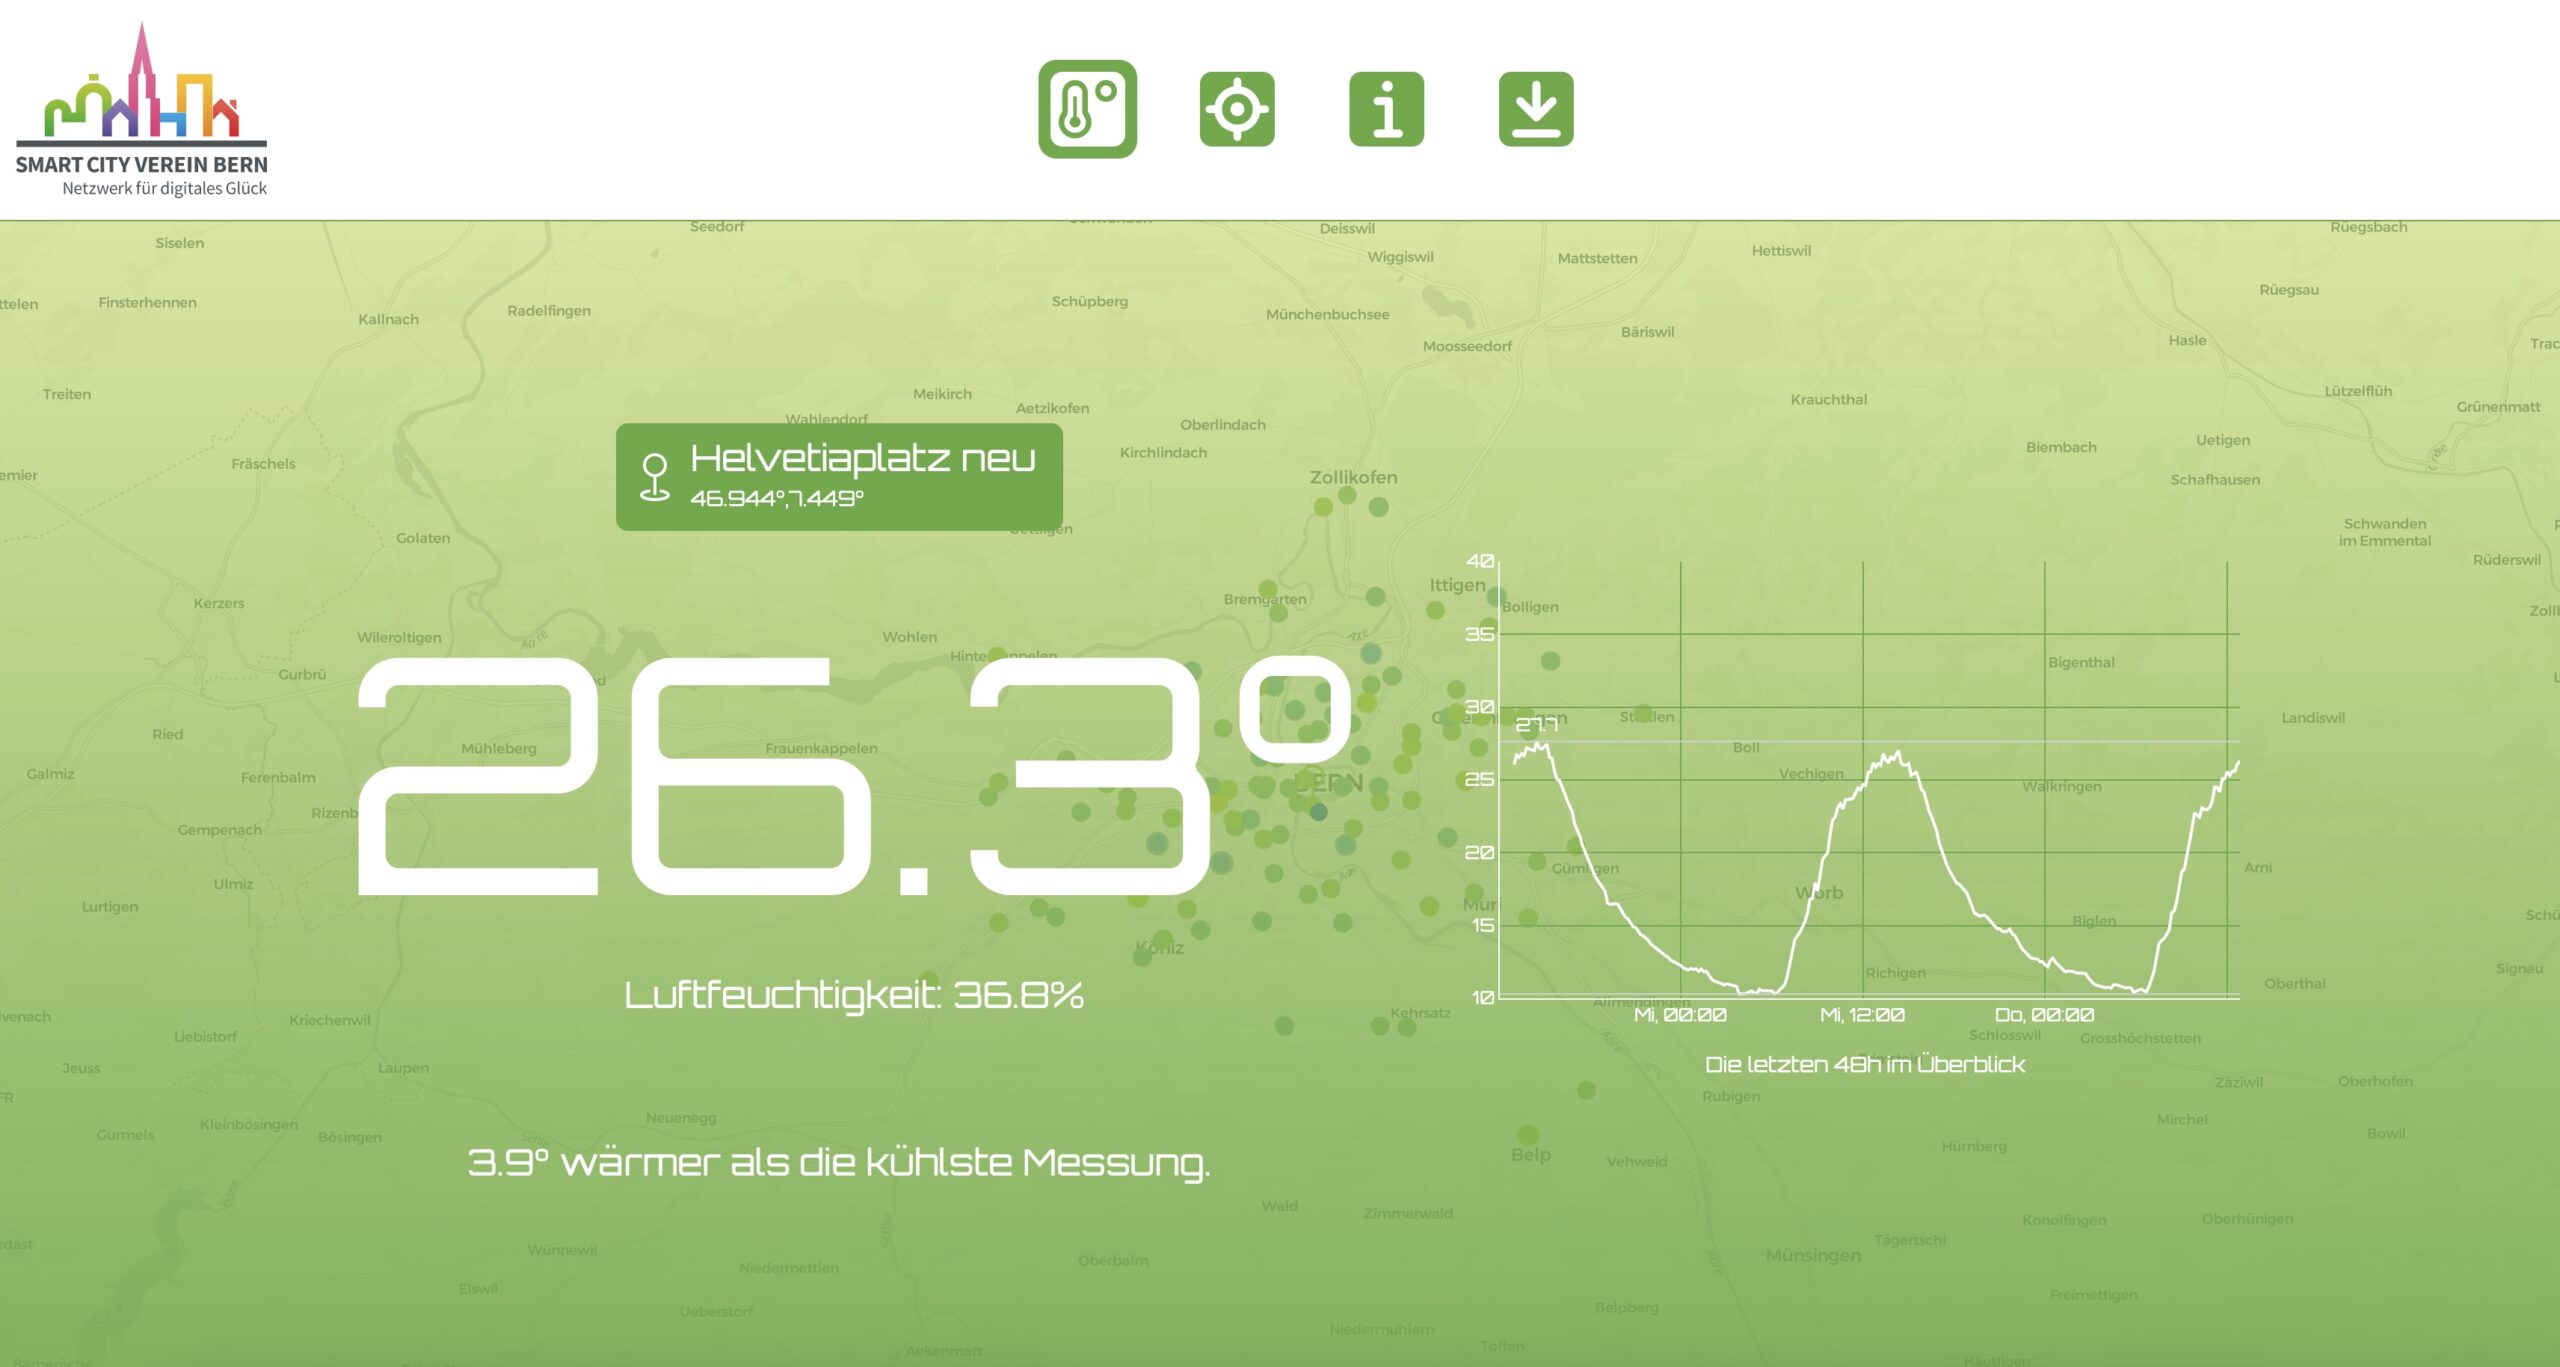
The Smart Urban Heat Map is an initiative of the Smart City Association Bern to visualise urban heat in the city and region of Bern. Live temperature readings from over 100 measuring stations are visualised on an interactive map. The temperature and relative humidity of the last 48 hours can be displayed as a time series for individual measuring stations. This project was made possible by the valuable work of the Climatology Group at the Institute of Geography at the University of Bern, which has been operating an urban measurement network since 2018, and the Smart Urban Heatmap Bern project led by the Smart City Verein Bern, which has expanded this measurement network into the Bern region together with the company Abilium GmbH, the Institute of Public Sector Transformation at Bern University of Applied Sciences and the company Meteotest and is making the data from both networks available as open data.
Die Smart Urban Heat Map ist eine Initiative des Smart City Vereins Bern zur Visualisierung der urbanen Hitze in Stadt und Region Bern. Live Temperatur Messwerte von über 100 Messstationen werden auf einer interaktiven Karte visualisiert. Für einzelne Messtationen können Temperatur und relative Feuchtigkeit der letzten 48 Stunden als Zeitreihe dargestellt werden. Ermöglicht wurde dieses Projekt durch die wertvolle Arbeit der Gruppe für Klimatologie am Geographischen Institut der Universität Bern, welche seit 2018 ein städtisches Messnetz betreibt und dem Smart Urban Heatmap Bern Projekt unter der Leitung des Smart City Verein Bern welches dieses Messnetz zusammen mit der Firma Abilium GmbH, dem Institut Public Sector Transformation der Berner Fachhochschule und der Firma Meteotest in die Region Bern hinaus erweitert hat und die Daten beider Netze als Open Data zur Verfügung stellt.
Data
https://opendata.swiss/de/dataset/temperatur-und-relative-feuchtigkeit-fur-stadt-und-region-bern
Smart Urban Heat Map API Documentation
This documentation describes the Open-Data API of the Smart Urban Heat Map Bern Project.
The Smart Urban Heat Map is an initiative of the Smart City Verein Bern to visualize urban heat in the city and region of Bern. Valuable pioneering work has been done by the Climatology Group at the Geographical Institute of the University of Bern (GIUB), which has been operating an urban measurement network since 2018, consisting of around 80 stations. The Smart City Verein Bern, together with the company Abilium GmbH, the Bern University of Applied Sciences and the company Meteotest, has extended this measuring network into the Bern region by around 40 measuring stations.
Based on this measurement network, the Smart Urban Heat Map API offers access to detailed city climate data for the region of Bern, Switzerland. Users can retrieve current measurements of temperature, relative humidity, and location metadata, as well as location-bound time series data. The data provides valuable insights for urban planning and environmental studies.
The documentation is complemented by an interactive OpenAPI specification and a Jupyter Notebook which includes examples of how to request and visualize the data using Python.
The notebook can be run locally or directly in the browser using
or
.
Licensing Information The data from the API is available under the Creative Commons Attribution License (CC-BY). Please ensure that you provide proper attribution when using or redistributing this data in your projects or applications. Attribution Example: Data provided by the Smart Urban Heat Map Project for Bern, Switzerland.
Contact Information For questions regarding the data, please contact the BFH. For questions regarding the locations and data of the project "Urban Climate Bern", please contact GIUB - Urban Climate Bern. For technical questions regarding the API, please contact Meteotest.
Table of Contents - Changelog - Stations, Sensors and Temperature Bias - Endpoints - Codebook - Example Requests
Changelog
API Version 2
This is the second version of the Smart Urban Heat Map API published on 18.06.2024.
Remark: In the initial version, the GeoJSON end point /stations (now called /latest) returned the lat/lon coordinates in the wrong order ([lat, lon] rather than [lon, lat]).
Stations, Sensors and Temperature Bias
The measuring stations are built by Abilium GmbH and are based on the SHT41A Sensorion sensors. The self-sufficient stations are outfitted with a small solar panel and measure temperature and relative humidity every 10 minutes. The measurement data is sent out via the Helium LoRaWAN network. To reduce the potential temperature bias when stations are exposed to direct sunlight, all stations are ventilated before measuring. However, in some cases, especially during the day, measured temperatures might still be slightly higher than actual temperatures.
Endpoints
latest
Retrieves station data including most recent measured value for:
- Temperature is in Celsius (°C).
- Relative Humidity is in percentage (%).
URL: https://smart-urban-heat-map.ch/api/v2/latest
Response Formats: GeoJSON (default), CSV
timeseries
Retrieves time series based on stationId for: * Temperature is in Celsius (°C). * Relative Humidity is in percentage (%).
URL: https://smart-urban-heat-map.ch/api/v2/timeseries
Response Formats: JSON (default), CSV
URL Parameter:
* stationId (required): specifies from which station to return the time series
* timeFrom (optional, default: "-24hours"): specifies start of time series (Examples: "-3days","-24hours","-30minutes", "2023-10-01T00:00:00Z")
* timeTo (optional, default: "now"): specifies end of time series (Examples: "-3days","-24hours","-30minutes", "now", "2023-10-01T00:00:00Z")
stations
Retrieves station data including date of most recent measurement.
URL: https://smart-urban-heat-map.ch/api/v2/stations
Response Formats: GeoJSON (default), CSV
Codebook
latest
- coordinates: Array representing the geographical coordinates (in WGS84) of the station (Longitude, Latitude)
- stationId: Unique identifier for the station (Example: "11004")
- name: Name of the station (Example: "Sandrain-Bern")
- dateObserved: Date and time of the last measurement (Example: "2023-08-01T12:00:00Z")
- temperature: Last temperature measured at the station in °C (Example: 18.925001)
- relativeHumidity: Last relative humidity measured at the station in % (Example: 60.971848)
timeseries
- stationId: Unique identifier for the station (Example: "11004")
- dateObserved: Date and time of the measurement (Example: "2023-08-01T12:00:00Z")
- temperature: Temperature measured at the station in °C (Example: 18.925001)
- relativeHumidity: Relative humidity measured at the station in % (Example: 60.971848)
stations
- coordinates: Array representing the geographical coordinates (in WGS84) of the station (Longitude, Latitude)
- stationId: Unique identifier for the station (Example: "11099")
- name: Name of the station (Example: "Sandrain-Bern")
- latestMeasurementDate: Date and time of the last measurement (Example: "2023-08-01T12:00:00Z")
Example Requests
Request list of stations and most recent measurements
GET https://smart-urban-heat-map.ch/api/v2/latest
{
  "type": "FeatureCollection",
  "features": [
    {
      "type": "Feature",
      "geometry": {
        "type": "Point",
        "coordinates": [
          7.43141,
          46.94067
        ]
      },
      "properties": {
        "stationId": "11037",
        "name": "Eigerplatz-Bern",
        "dateObserved": "2023-10-05T11:36:29Z",
        "temperature": 18.925001,
        "relativeHumidity": 60.971848
      }
    },
    {
      "type": "Feature",
      "geometry": {
        "type": "Point",
        "coordinates": [
          7.439139,
          46.96681
        ]
      },
      "properties": {
        "stationId": "11127",
        "name": "Worblen-Ostermundigen",
        "dateObserved": "2023-10-05T11:36:27Z",
        "temperature": 18.791485,
        "relativeHumidity": 62.507286
      }
    },
    ...
  ]
}
Request timeseries for a station
GET https://smart-urban-heat-map.ch/api/v2/timeseries?stationId=11023&timeFrom=2023-10-01T00:00:00Z&timeTo=2023-10-31T23:00:00Z
{
  "stationId": "11023",
  "values": [
    {
      "dateObserved": "2023-10-01T00:05:45Z",
      "temperature": 14.193179,
      "relativeHumidity": 86.94652
    },
    {
      "dateObserved": "2023-10-01T00:15:45Z",
      "temperature": 14.20386,
      "relativeHumidity": 87.801025
    },
    {
      "dateObserved": "2023-10-01T00:25:45Z",
      "temperature": 14.03563,
      "relativeHumidity": 88.541084
    },
    ...
  ]
}
Request list of stations and date of most recent measurement
GET https://smart-urban-heat-map.ch/api/v2/stations
{
  "type": "FeatureCollection",
  "features": [
    {
      "type": "Feature",
      "geometry": {
        "type": "Point",
        "coordinates": [
          7.43141,
          46.94067
        ]
      },
      "properties": {
        "stationId": "11037",
        "name": "Eigerplatz-Bern",
        "latestMeasurementDate": "2023-10-05T11:36:29Z",
      }
    },
    {
      "type": "Feature",
      "geometry": {
        "type": "Point",
        "coordinates": [
          7.439139,
          46.96681
        ]
      },
      "properties": {
        "stationId": "11127",
        "name": "Worblen-Ostermundigen",
        "latestMeasurementDate": "2023-10-05T11:36:27Z",
      }
    },
    ...
  ]
}

Train O'Clock
Train O'Clock ermöglicht Pendlern den sofortigen Zugriff auf ihre Zugfahrpläne in der Schweiz.
Die wichtigsten Funktionen sind: Abfahrten und Ankünfte von jedem Bahnhof in der Schweiz in Echtzeit Zugriff auf Tages- und Wochenfahrpläne zur Planung Ihrer Zugreise mit der SBB
TrainO'Clock ist schnell, zuverlässig und sehr einfach zu bedienen.
Train O'Clock permet aux pendulaires d'accéder instantanément à leurs horaires de train en Suisse.
Les principales caractéristiques sont les suivantes : départs et arrivées en direct de n'importe quelle gare de Suisse; accès aux horaires quotidiens et hebdomadaires pour planifier votre voyage en train avec les CFF.
TrainO'Clock est rapide, fiable et très simple à utiliser.
Train O’Clock helps commuters to instantly access their train schedules in Switzerland.
Key features are: Live departures and arrivals from your any railway station in Switzerland Access to daily timetables and weekly schedules to plan your train trip with SBB
TrainO'Clock is fast, reliable, super simple to use
Android app is available here: https://play.google.com/store/apps/details?id=com.trainoclock.application
iOS app is available here: https://apps.apple.com/us/app/train-oclock/id6467878067
Data
swisspeaX
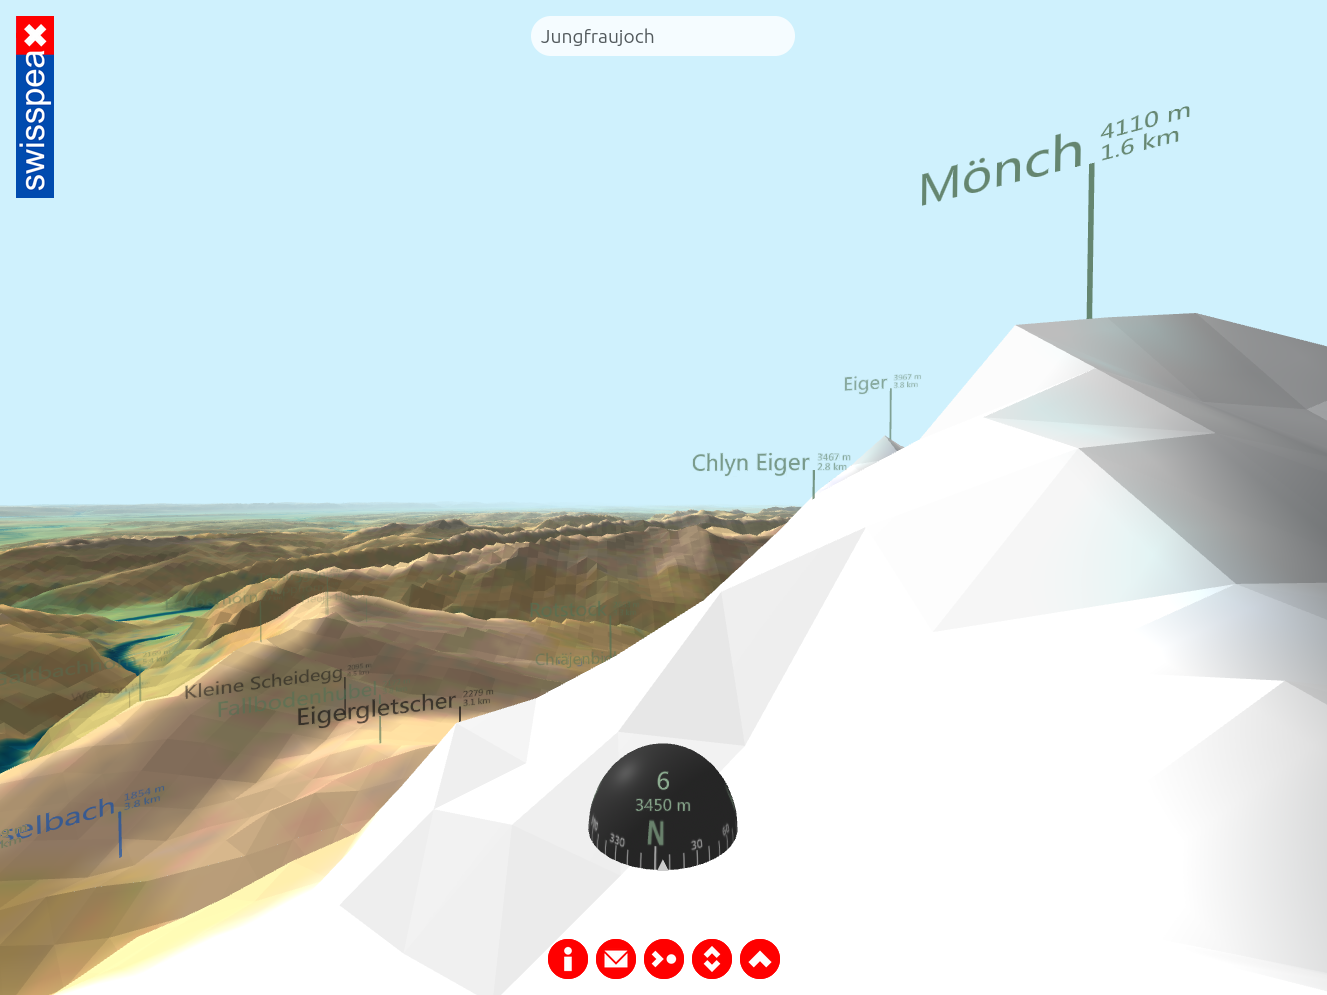
The web app "swisspeaX" displays the entire topography of Switzerland as seen by the user at their actual location. Provided that the user agrees to GPS localization, "swisspeaX" displays the landscape at the correct altitude and position, and shows the names of all nearby towns, bodies of water, hills and mountain peaks (including distance and sea level).
Die Webapp "swisspeaX" bildet die gesamte Schweizer Topografie nach, so wie sie die Nutzerin/der Nutzer an seinem aktuellen Standort sehen kann. Eine Zustimmung zur GPS-Lokalisierung vorausgesetzt, stellt "swisspeaX" die Landschaft höhen- und lagerichtig dar und blendet die Namen aller nahegelegenen Ortschaften, Gewässer, Hügel sowie Berggipfel (jeweils einschliesslich Distanz und Meereshöhe) ein.
L'application web "swisspeaX" reproduit l'ensemble de la topographie suisse telle que l'utilisateur peut la voir à son emplacement actuel. Si l'utilisateur accepte la localisation GPS, "swisspeaX" représente le paysage en fonction de l'altitude et de la position et affiche les noms de toutes les localités proches, des cours d'eau, des collines et des sommets (y compris la distance et l'altitude).
Data
https://opendata.swiss/de/dataset/swissnames3d-geografische-namen-der-landesvermessung

