Challenge view
Back to ProjectSmart Urban Heatmap Bern
API Dokumentation zu smart-urban-heat-map.ch
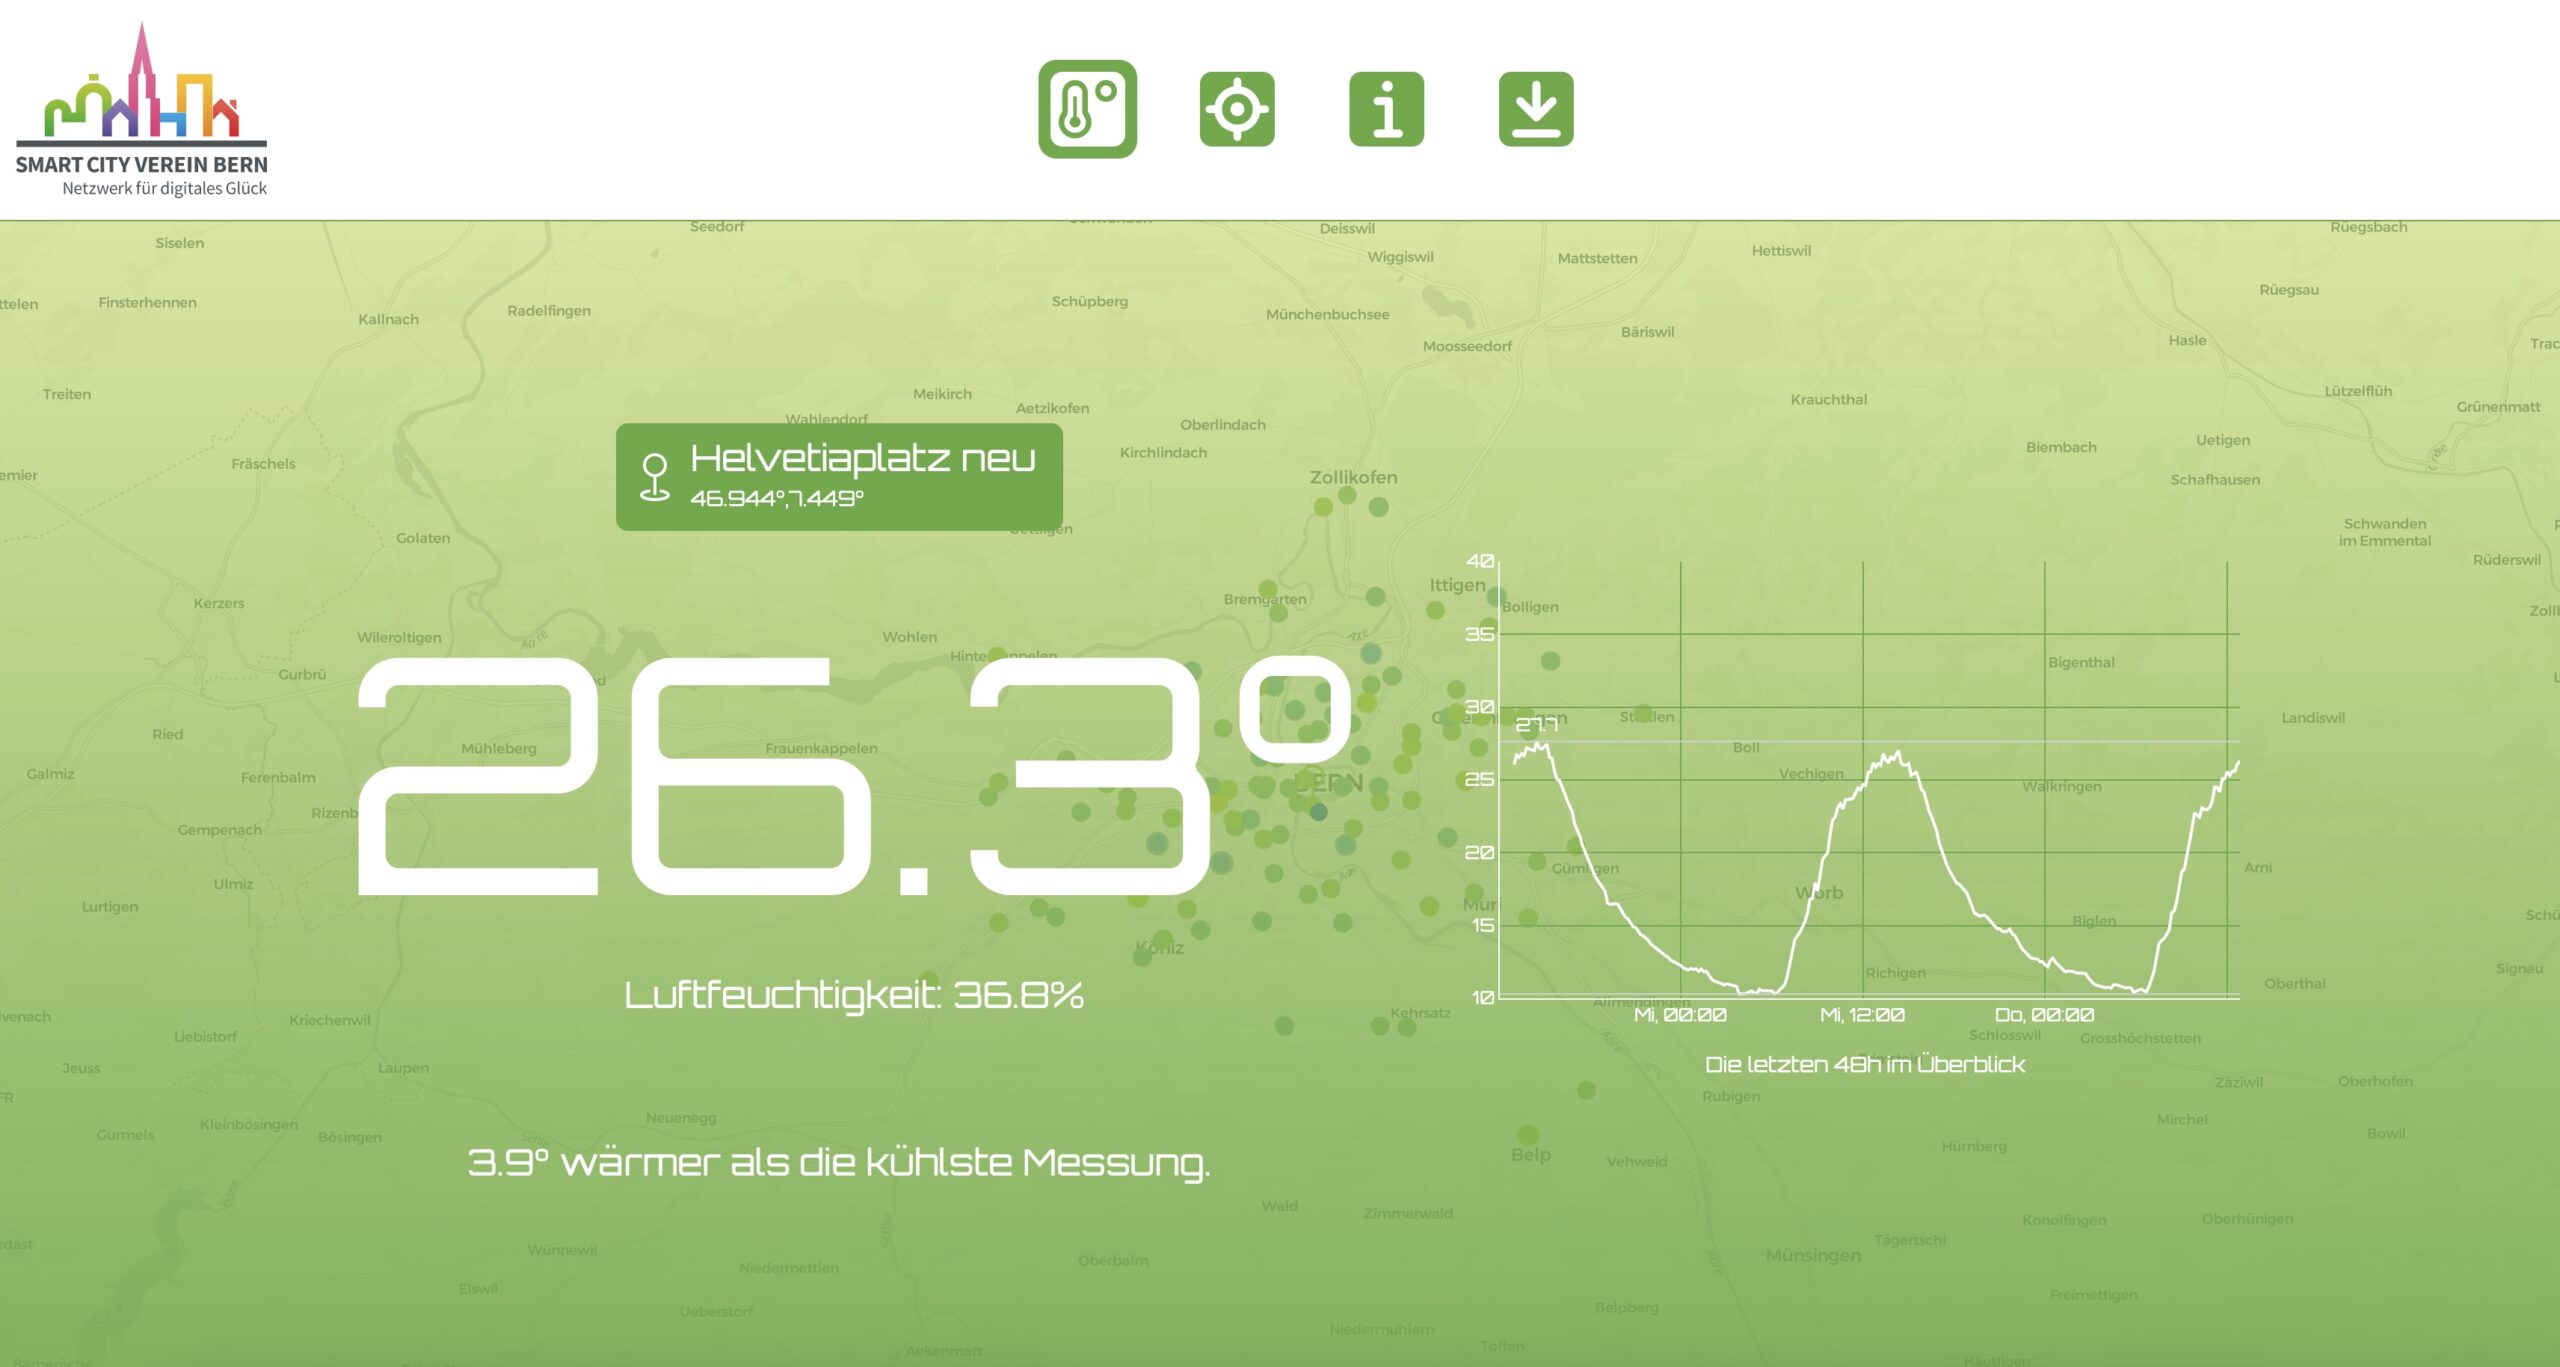
The Smart Urban Heat Map is an initiative of the Smart City Association Bern to visualise urban heat in the city and region of Bern. Live temperature readings from over 100 measuring stations are visualised on an interactive map. The temperature and relative humidity of the last 48 hours can be displayed as a time series for individual measuring stations. This project was made possible by the valuable work of the Climatology Group at the Institute of Geography at the University of Bern, which has been operating an urban measurement network since 2018, and the Smart Urban Heatmap Bern project led by the Smart City Verein Bern, which has expanded this measurement network into the Bern region together with the company Abilium GmbH, the Institute of Public Sector Transformation at Bern University of Applied Sciences and the company Meteotest and is making the data from both networks available as open data.
Die Smart Urban Heat Map ist eine Initiative des Smart City Vereins Bern zur Visualisierung der urbanen Hitze in Stadt und Region Bern. Live Temperatur Messwerte von über 100 Messstationen werden auf einer interaktiven Karte visualisiert. Für einzelne Messtationen können Temperatur und relative Feuchtigkeit der letzten 48 Stunden als Zeitreihe dargestellt werden. Ermöglicht wurde dieses Projekt durch die wertvolle Arbeit der Gruppe für Klimatologie am Geographischen Institut der Universität Bern, welche seit 2018 ein städtisches Messnetz betreibt und dem Smart Urban Heatmap Bern Projekt unter der Leitung des Smart City Verein Bern welches dieses Messnetz zusammen mit der Firma Abilium GmbH, dem Institut Public Sector Transformation der Berner Fachhochschule und der Firma Meteotest in die Region Bern hinaus erweitert hat und die Daten beider Netze als Open Data zur Verfügung stellt.
Data
Smart Urban Heat Map API Documentation
![]()
![]()
This documentation describes the Open-Data API of the Smart Urban Heat Map Bern Project.
The Smart Urban Heat Map is an initiative of the Smart City Verein Bern to visualize urban heat in the city and region of Bern. Valuable pioneering work has been done by the Climatology Group at the Geographical Institute of the University of Bern (GIUB), which has been operating an urban measurement network since 2018, consisting of around 80 stations. The Smart City Verein Bern, together with the company Abilium GmbH, the Bern University of Applied Sciences and the company Meteotest, has extended this measuring network into the Bern region by around 40 measuring stations.
Based on this measurement network, the Smart Urban Heat Map API offers access to detailed city climate data for the region of Bern, Switzerland. Users can retrieve current measurements of temperature, relative humidity, and location metadata, as well as location-bound time series data. The data provides valuable insights for urban planning and environmental studies.
The documentation is complemented by an interactive OpenAPI specification and a Jupyter Notebook which includes examples of how to request and visualize the data using Python.
The notebook can be run locally or directly in the browser using ![]() or
or ![]() .
.
Licensing Information The data from the API is available under the Creative Commons Attribution License (CC-BY). Please ensure that you provide proper attribution when using or redistributing this data in your projects or applications. Attribution Example: Data provided by the Smart Urban Heat Map Project for Bern, Switzerland.
Contact Information For questions regarding the data, please contact the BFH. For questions regarding the locations and data of the project "Urban Climate Bern", please contact GIUB - Urban Climate Bern. For technical questions regarding the API, please contact Meteotest.
Table of Contents - Changelog - Stations, Sensors and Temperature Bias - Endpoints - Codebook - Example Requests
Changelog
API Version 2
This is the second version of the Smart Urban Heat Map API published on 18.06.2024.
Remark: In the initial version, the GeoJSON end point /stations (now called /latest) returned the lat/lon coordinates in the wrong order ([lat, lon] rather than [lon, lat]).
Stations, Sensors and Temperature Bias
The measuring stations are built by Abilium GmbH and are based on the SHT41A Sensorion sensors. The self-sufficient stations are outfitted with a small solar panel and measure temperature and relative humidity every 10 minutes. The measurement data is sent out via the Helium LoRaWAN network. To reduce the potential temperature bias when stations are exposed to direct sunlight, all stations are ventilated before measuring. However, in some cases, especially during the day, measured temperatures might still be slightly higher than actual temperatures.
Endpoints
latest
Retrieves station data including most recent measured value for:
- Temperature is in Celsius (°C).
- Relative Humidity is in percentage (%).
URL: https://smart-urban-heat-map.ch/api/v2/latest
Response Formats: GeoJSON (default), CSV
timeseries
Retrieves time series based on stationId for: * Temperature is in Celsius (°C). * Relative Humidity is in percentage (%).
URL: https://smart-urban-heat-map.ch/api/v2/timeseries
Response Formats: JSON (default), CSV
URL Parameter:
* stationId (required): specifies from which station to return the time series
* timeFrom (optional, default: "-24hours"): specifies start of time series (Examples: "-3days","-24hours","-30minutes", "2023-10-01T00:00:00Z")
* timeTo (optional, default: "now"): specifies end of time series (Examples: "-3days","-24hours","-30minutes", "now", "2023-10-01T00:00:00Z")
stations
Retrieves station data including date of most recent measurement.
URL: https://smart-urban-heat-map.ch/api/v2/stations
Response Formats: GeoJSON (default), CSV
Codebook
latest
- coordinates: Array representing the geographical coordinates (in WGS84) of the station (Longitude, Latitude)
- stationId: Unique identifier for the station (Example: "11004")
- name: Name of the station (Example: "Sandrain-Bern")
- dateObserved: Date and time of the last measurement (Example: "2023-08-01T12:00:00Z")
- temperature: Last temperature measured at the station in °C (Example: 18.925001)
- relativeHumidity: Last relative humidity measured at the station in % (Example: 60.971848)
timeseries
- stationId: Unique identifier for the station (Example: "11004")
- dateObserved: Date and time of the measurement (Example: "2023-08-01T12:00:00Z")
- temperature: Temperature measured at the station in °C (Example: 18.925001)
- relativeHumidity: Relative humidity measured at the station in % (Example: 60.971848)
stations
- coordinates: Array representing the geographical coordinates (in WGS84) of the station (Longitude, Latitude)
- stationId: Unique identifier for the station (Example: "11099")
- name: Name of the station (Example: "Sandrain-Bern")
- latestMeasurementDate: Date and time of the last measurement (Example: "2023-08-01T12:00:00Z")
Example Requests
Request list of stations and most recent measurements
GET https://smart-urban-heat-map.ch/api/v2/latest
{
  "type": "FeatureCollection",
  "features": [
    {
      "type": "Feature",
      "geometry": {
        "type": "Point",
        "coordinates": [
          7.43141,
          46.94067
        ]
      },
      "properties": {
        "stationId": "11037",
        "name": "Eigerplatz-Bern",
        "dateObserved": "2023-10-05T11:36:29Z",
        "temperature": 18.925001,
        "relativeHumidity": 60.971848
      }
    },
    {
      "type": "Feature",
      "geometry": {
        "type": "Point",
        "coordinates": [
          7.439139,
          46.96681
        ]
      },
      "properties": {
        "stationId": "11127",
        "name": "Worblen-Ostermundigen",
        "dateObserved": "2023-10-05T11:36:27Z",
        "temperature": 18.791485,
        "relativeHumidity": 62.507286
      }
    },
    ...
  ]
}
Request timeseries for a station
GET https://smart-urban-heat-map.ch/api/v2/timeseries?stationId=11023&timeFrom=2023-10-01T00:00:00Z&timeTo=2023-10-31T23:00:00Z
{
  "stationId": "11023",
  "values": [
    {
      "dateObserved": "2023-10-01T00:05:45Z",
      "temperature": 14.193179,
      "relativeHumidity": 86.94652
    },
    {
      "dateObserved": "2023-10-01T00:15:45Z",
      "temperature": 14.20386,
      "relativeHumidity": 87.801025
    },
    {
      "dateObserved": "2023-10-01T00:25:45Z",
      "temperature": 14.03563,
      "relativeHumidity": 88.541084
    },
    ...
  ]
}
Request list of stations and date of most recent measurement
GET https://smart-urban-heat-map.ch/api/v2/stations
{
  "type": "FeatureCollection",
  "features": [
    {
      "type": "Feature",
      "geometry": {
        "type": "Point",
        "coordinates": [
          7.43141,
          46.94067
        ]
      },
      "properties": {
        "stationId": "11037",
        "name": "Eigerplatz-Bern",
        "latestMeasurementDate": "2023-10-05T11:36:29Z",
      }
    },
    {
      "type": "Feature",
      "geometry": {
        "type": "Point",
        "coordinates": [
          7.439139,
          46.96681
        ]
      },
      "properties": {
        "stationId": "11127",
        "name": "Worblen-Ostermundigen",
        "latestMeasurementDate": "2023-10-05T11:36:27Z",
      }
    },
    ...
  ]
}